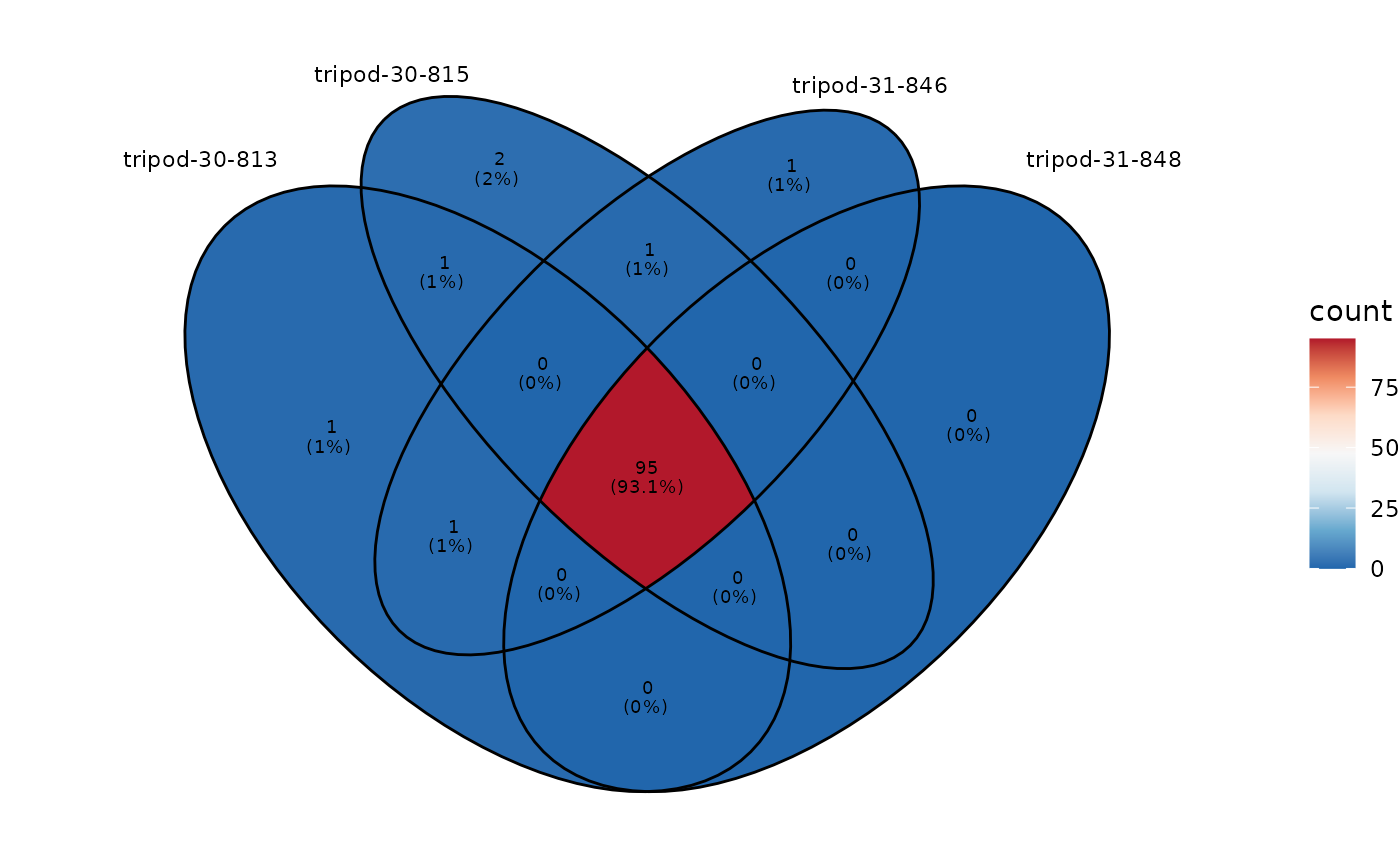
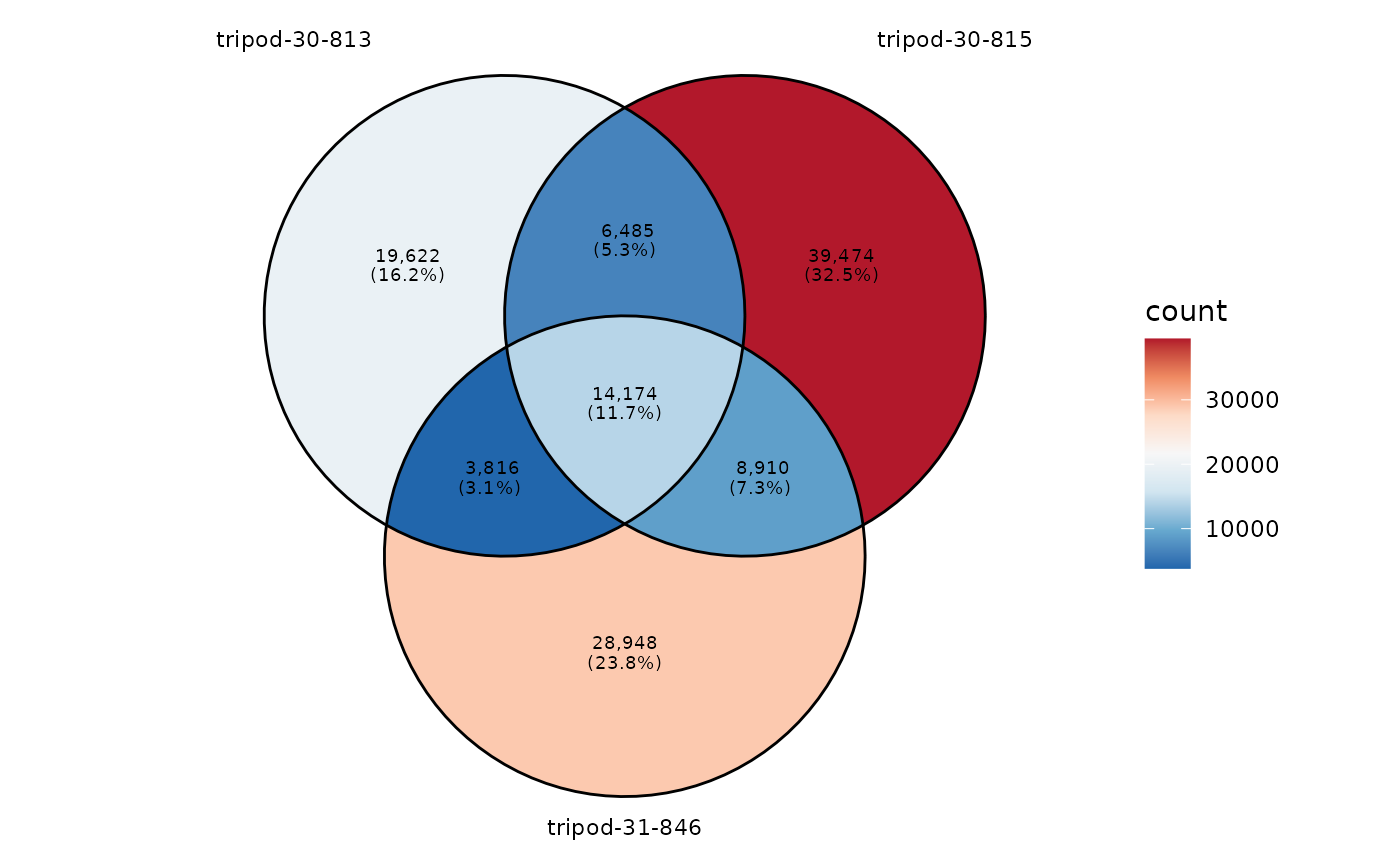
Visualization of the inter-repertoire sharing on an Venn diagram
Source:R/plotFunctions.R
plotVenn.RdThe repertoire sharing at any level evaluates the degree of convergence between repertoires and experimental conditions.
This function plots the number of shared sequences, at any repertoire level, between samples belonging for instance, to a same experimental group. No limitations in the number of sample_ids is imposed, however for visualization purposes, a maximum of 5 sample_ids should be ideally specified.
Usage
plotVenn(
  x,
  level = c("aaClone", "ntClone", "V", "J", "VJ", "ntCDR3", "aaCDR3"),
  sampleNames = NULL
)
Arguments
- x
an object of class
RepSeqExperiment- level
a character specifying the level of the repertoire on which the diversity should be estimated. Should be one of "aaClone","ntClone", "V", "J", "VJ", "ntCDR3" or "aaCDR3".
- sampleNames
a vector of character indicating the sample_ids of the repertoires to be analyzed. If not specified, the first three samples in the dataset are analyzed.