This function plots the statistics in the mData slot, calculated for each sample during the building of the RepSeqExperiment object.
These statistics include:
- nSequences: the total number of sequences in a sample
- ntCDR3: the number of unique nucleotide CDR3s
- aaCDR3: the number of unique amino acid CDR3s
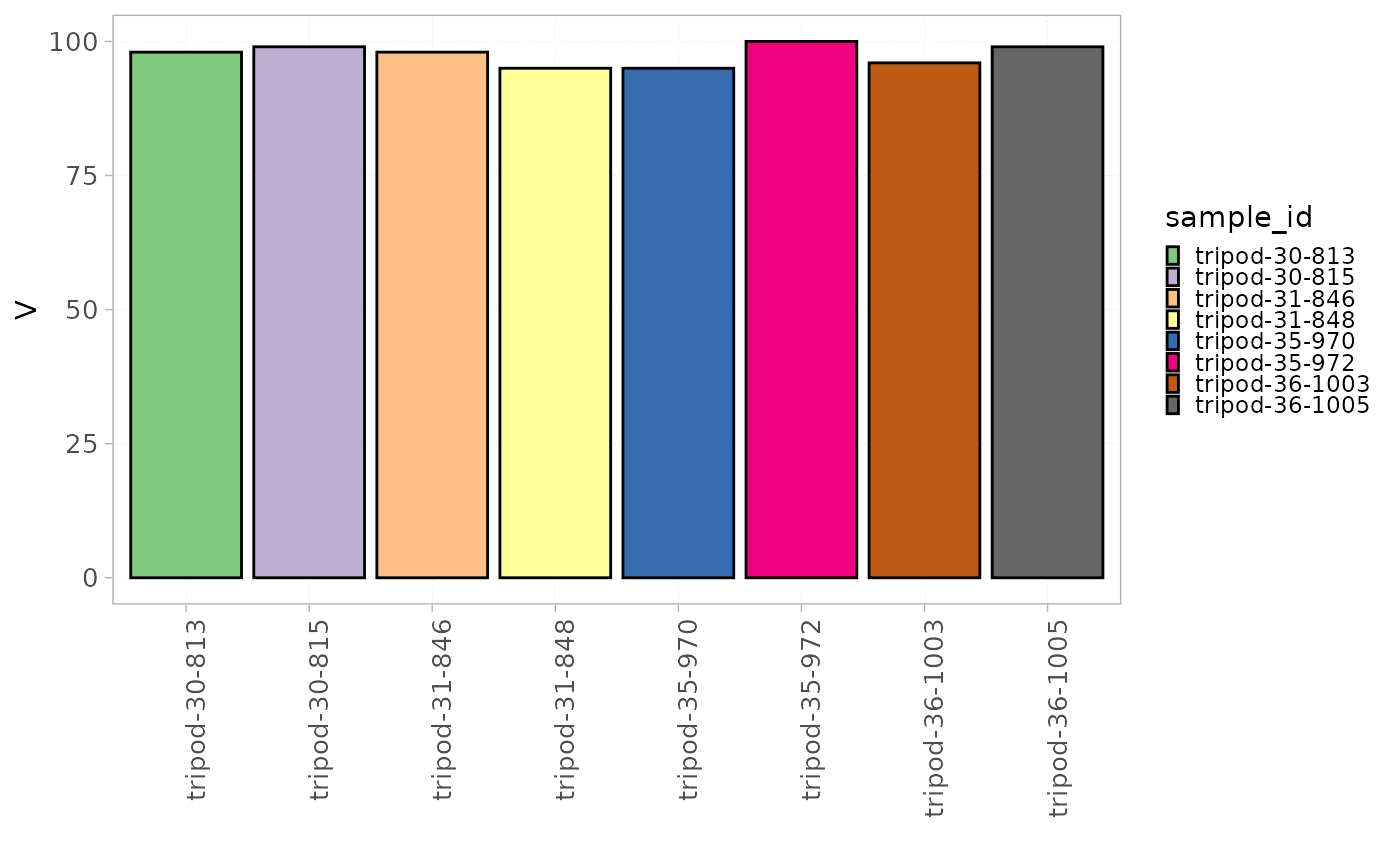
- V: the total number of V genes expressed in each sample
- J: the total number of J genes
- VJ: the total number of V-J gene combinations
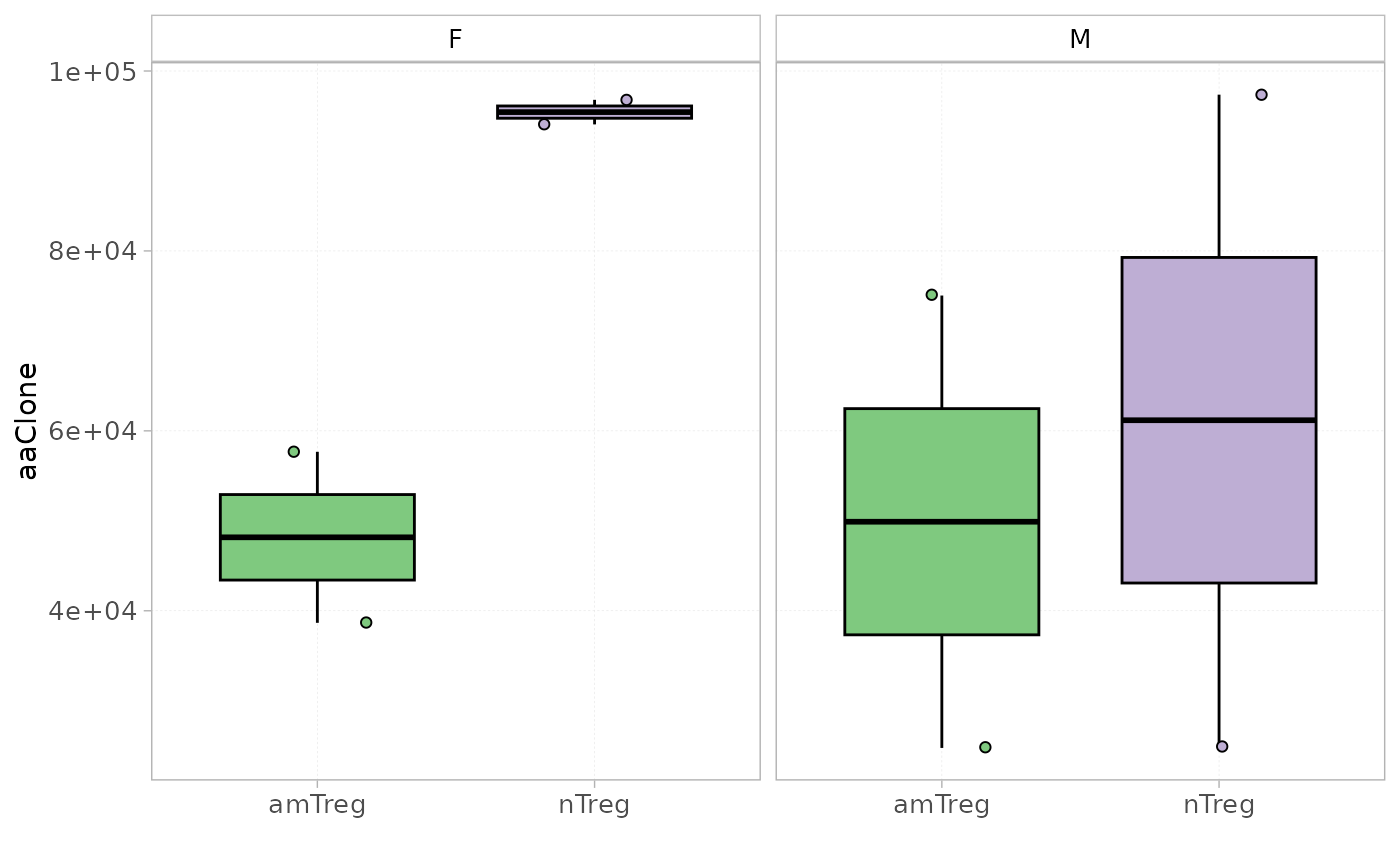
- aaClone: the number of unique aaClones
- ntClone: the number of unique ntClones
Or any other user-defined numeric statistics in the metadata.
They can be compared between groups of samples or simply plotted for each sample.
Usage
plotStatistics(
  x,
  stat = NULL,
  colorBy = NULL,
  facetBy = NULL,
  label_colors = NULL,
  grouped = FALSE,
  show_stats = FALSE
)
Arguments
- x
an object of class
RepSeqExperiment- stat
a character specifying any numeric column name in the metadata to plot.
- colorBy
a character indicating a column name in mData. Colors are thus attributed to the different groups within this column. The chosen column must be of class factor.
- facetBy
a vector of character indicating one or two column names in mData to apply a facet on.
- label_colors
a list of colors for each variable in groupBy See
plotColors. If NULL, default colors are used.- grouped
a character indicating one or multiple groups to be compared. A Wilcoxon test is thus performed and adjusted p-values using the Holm method are shown. Colors are attributed to the different groups within the first column, and a facet is applied on the second column. If not specified, no statistical tests will be performed, and calculated values for each sample_id will be represented.
- show_stats
whether to statistically compare groups
Examples
data(RepSeqData)

plotStatistics(x = RepSeqData, stat = "V", colorBy = "sample_id")


plotStatistics(x = RepSeqData, colorBy = "cell_subset",
              facetBy="sex", stat = "aaClone", grouped=TRUE)
plotStatistics(x = RepSeqData, colorBy = "cell_subset",
facetBy="sex", stat = "aaClone", grouped=TRUE)