This function plots the values of two statistics in the mData slot along two axes for all the samples in the datatset. It shows the relationship between them.
These statistics include:
- nSequences: the total number of sequences in a sample
- ntCDR3: the number of unique nucleotide CDR3s
- aaCDR3: the number of unique amino acid CDR3s
- V: the total number of V genes expressed in each sample
- J: the total number of J genes
- VJ: the total number of V-J gene combinations
- aaClone: the number of unique aaClones
- ntClone: the number of unique ntClones
- Chao1: Estimates undetected species using the information on the rarest species (the numbers of singletons and doubletons) (Chao, 1984).
- Improved Chao1: An extension of Chao1 which uses additional information, namely, the numbers of tripletons and quadrupletons (Chiu et al., 2014).
Or any other user-defined numeric statistics in the metadata.
Usage
plotStatScatter(
  x,
  stat1 = NULL,
  stat2 = NULL,
  colorBy = NULL,
  facetBy = NULL,
  label_colors = NULL
)
Arguments
- x
an object of class
RepSeqExperiment- stat1
a character specifying the first numeric column name in the metadata to plot.
- stat2
a character specifying the second numeric column name in the metadata to plot.
- colorBy
a character indicating a column name in mData. Colors are thus attributed to the different groups within this column. The chosen column must be of class factor.
- facetBy
a vector of character indicating one or two column names in mData to apply a facet on.
- label_colors
a list of colors for each variable in groupBy See
plotColors. If NULL, default colors are used.
Examples
data(RepSeqData)
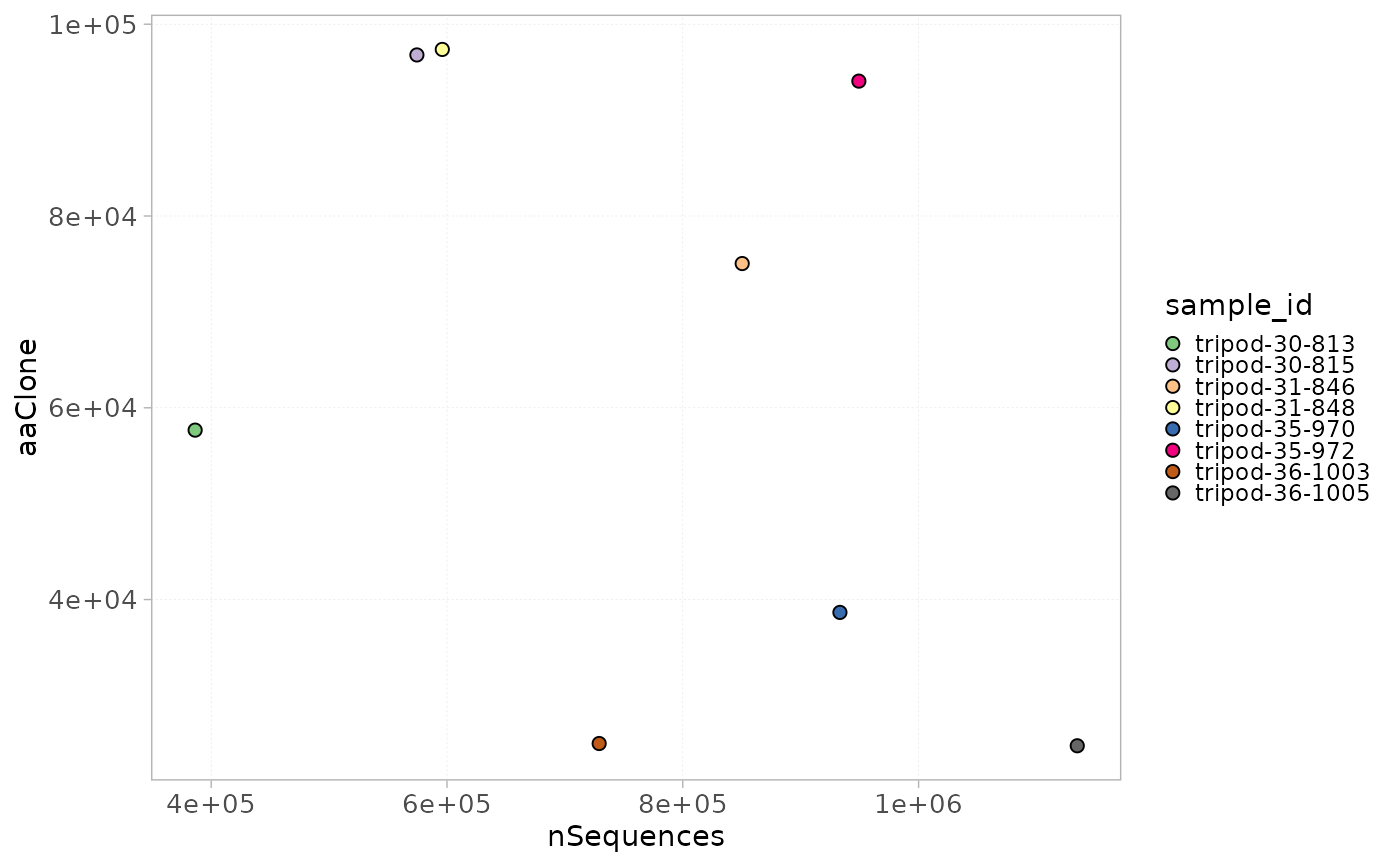
plotStatScatter(x = RepSeqData, stat1 = "nSequences", stat2 = "aaClone", colorBy = "sample_id")
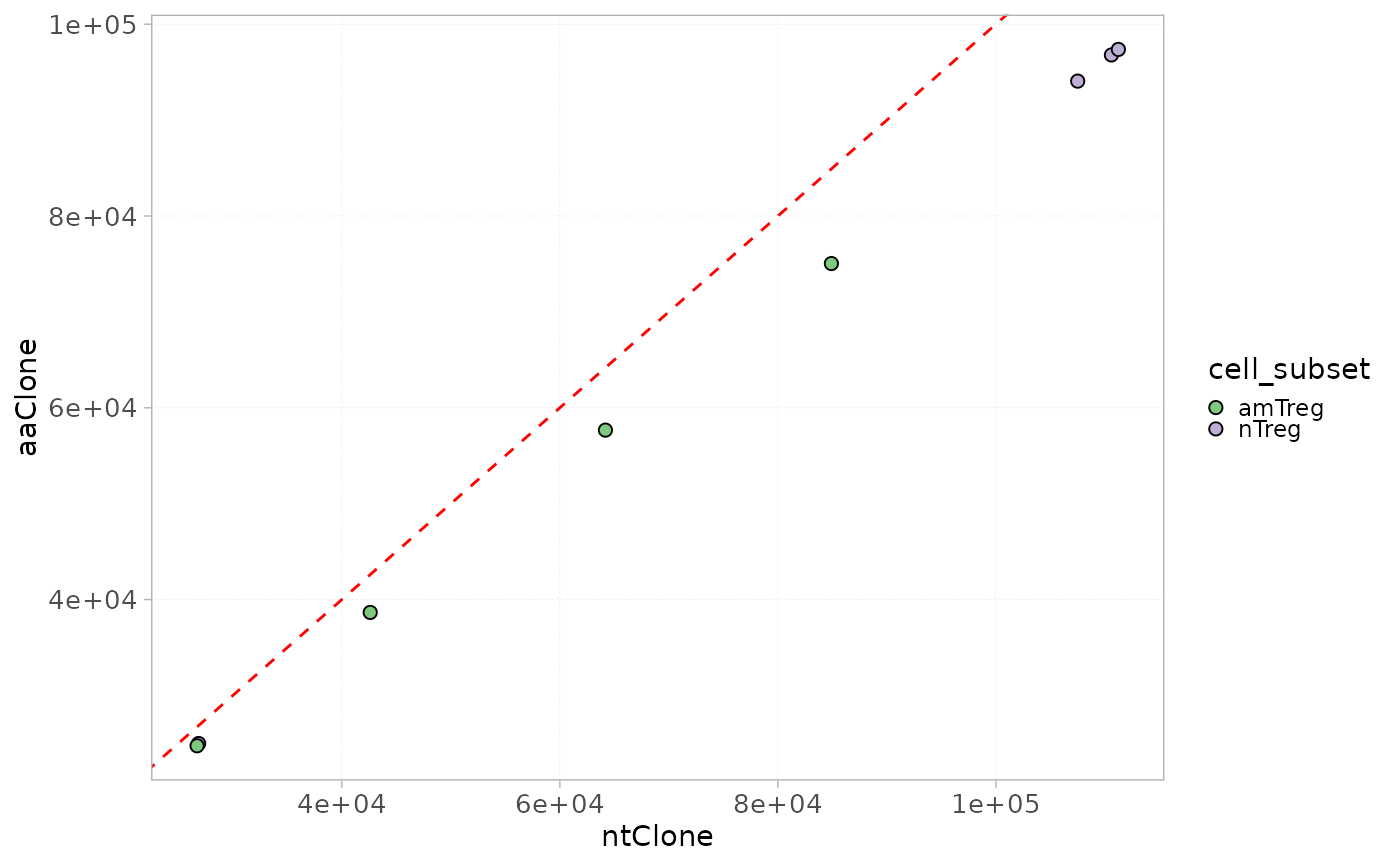
 plotStatScatter(x = RepSeqData, stat1 = "ntClone", stat2 = "aaClone", colorBy = "cell_subset")
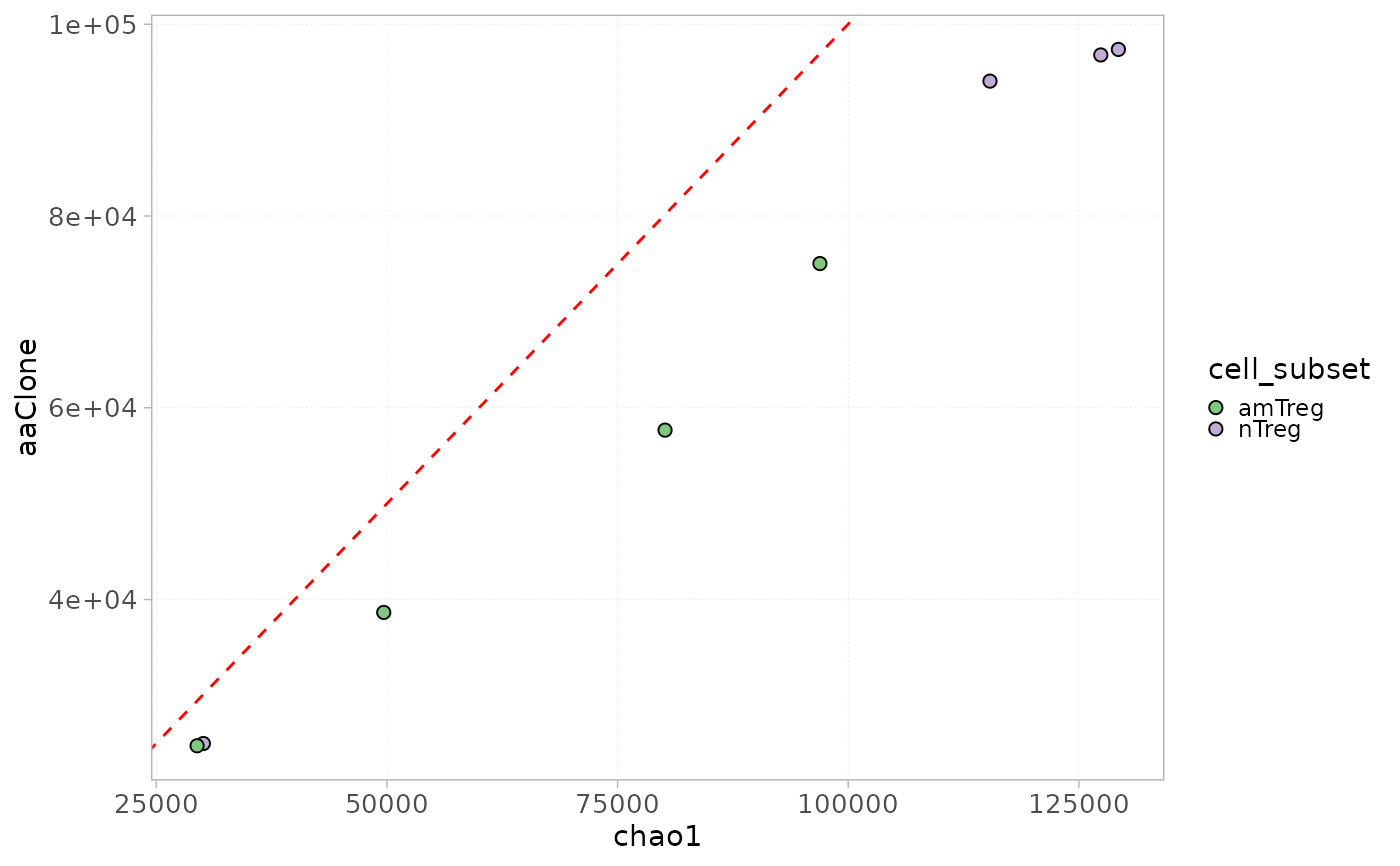
 plotStatScatter(x = RepSeqData, stat1 = "chao1", stat2 = "aaClone", colorBy = "cell_subset")