Visualization of the inter-repertoire sharing on a scatter plot
Source:R/plotFunctions.R
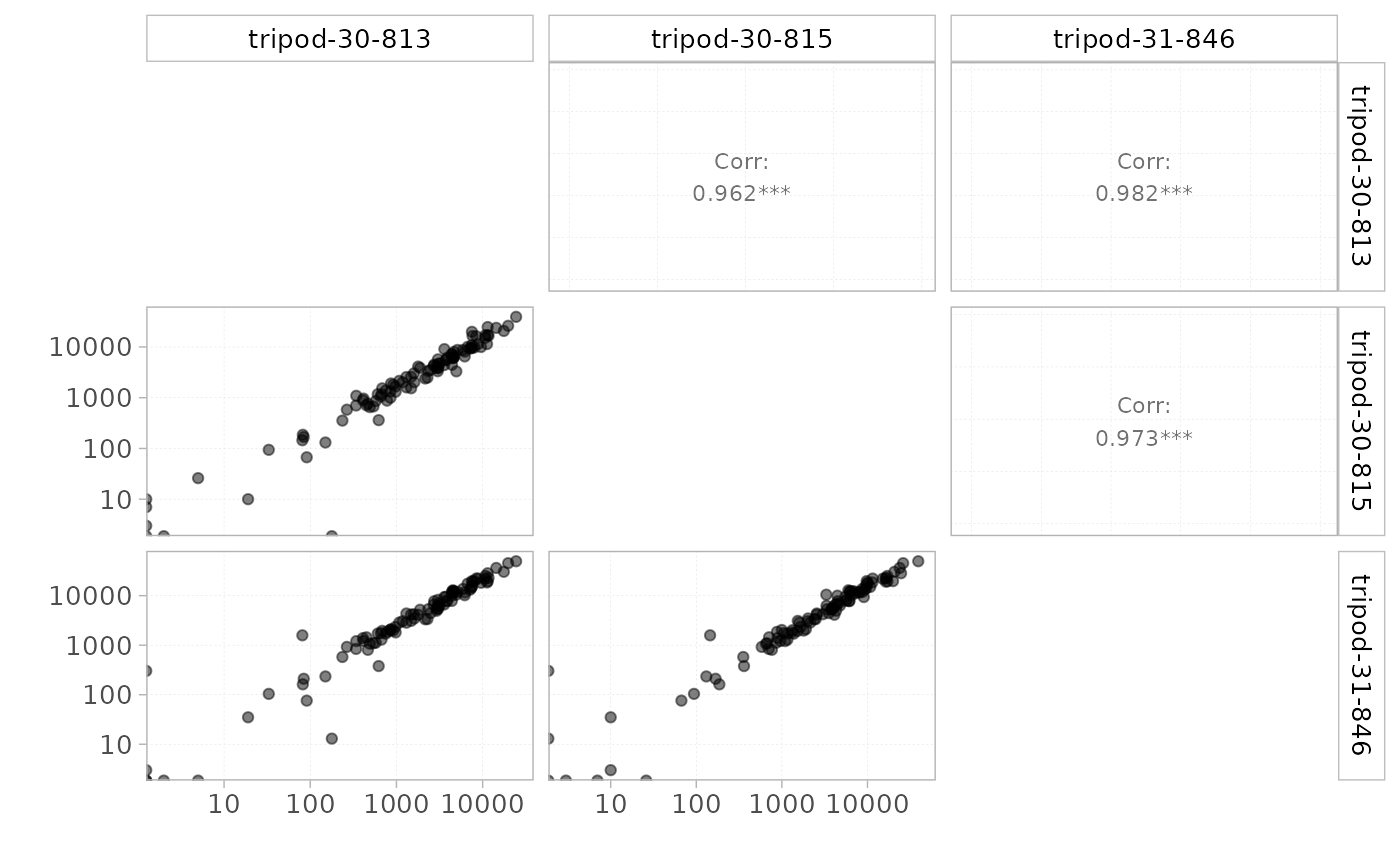
plotScatter.RdThis function computes a correlation between a pair of repertoires at any repertoire level. It allows a comparative analysis of the occurrence of a given repertoire level between a pair of samples, which goes beyond the simple calculation of the sharing degree.
Arguments
- x
an object of class
RepSeqExperiment- sampleNames
a vector of character indicating the two sample_ids of the repertoires to be analyzed.
- level
a character specifying the level of the repertoire to be analyzes. Should be one of "aaClone", "ntClone", "V", "J", "VJ", "ntCDR3" or "aaCDR3".
- scale
a character specifying whether to plot in "count" , "frequency". or "log'
- shiny
default is FALSE. whether to plot the shiny compatible version
Examples
data(RepSeqData)
plotScatter(x = RepSeqData,
            level = "V",
            sampleNames = c("tripod-30-813", "tripod-30-815", "tripod-31-846"),
            scale = "log")
#> Warning: log-10 transformation introduced infinite values.
#> Warning: log-10 transformation introduced infinite values.
#> Warning: log-10 transformation introduced infinite values.
#> Warning: log-10 transformation introduced infinite values.
#> Warning: log-10 transformation introduced infinite values.
#> Warning: log-10 transformation introduced infinite values.


plotScatter(x = RepSeqData,
            level = "aaClone",
            sampleNames = c("tripod-30-813", "tripod-30-815"),
            scale = "frequency")
#> Warning: Ignoring unknown parameters: `label.fontface`
#> `geom_smooth()` using formula = 'y ~ x'
plotScatter(x = RepSeqData,
level = "aaClone",
sampleNames = c("tripod-30-813", "tripod-30-815"),
scale = "frequency")
#> Warning: Ignoring unknown parameters: `label.fontface`
#> `geom_smooth()` using formula = 'y ~ x'
