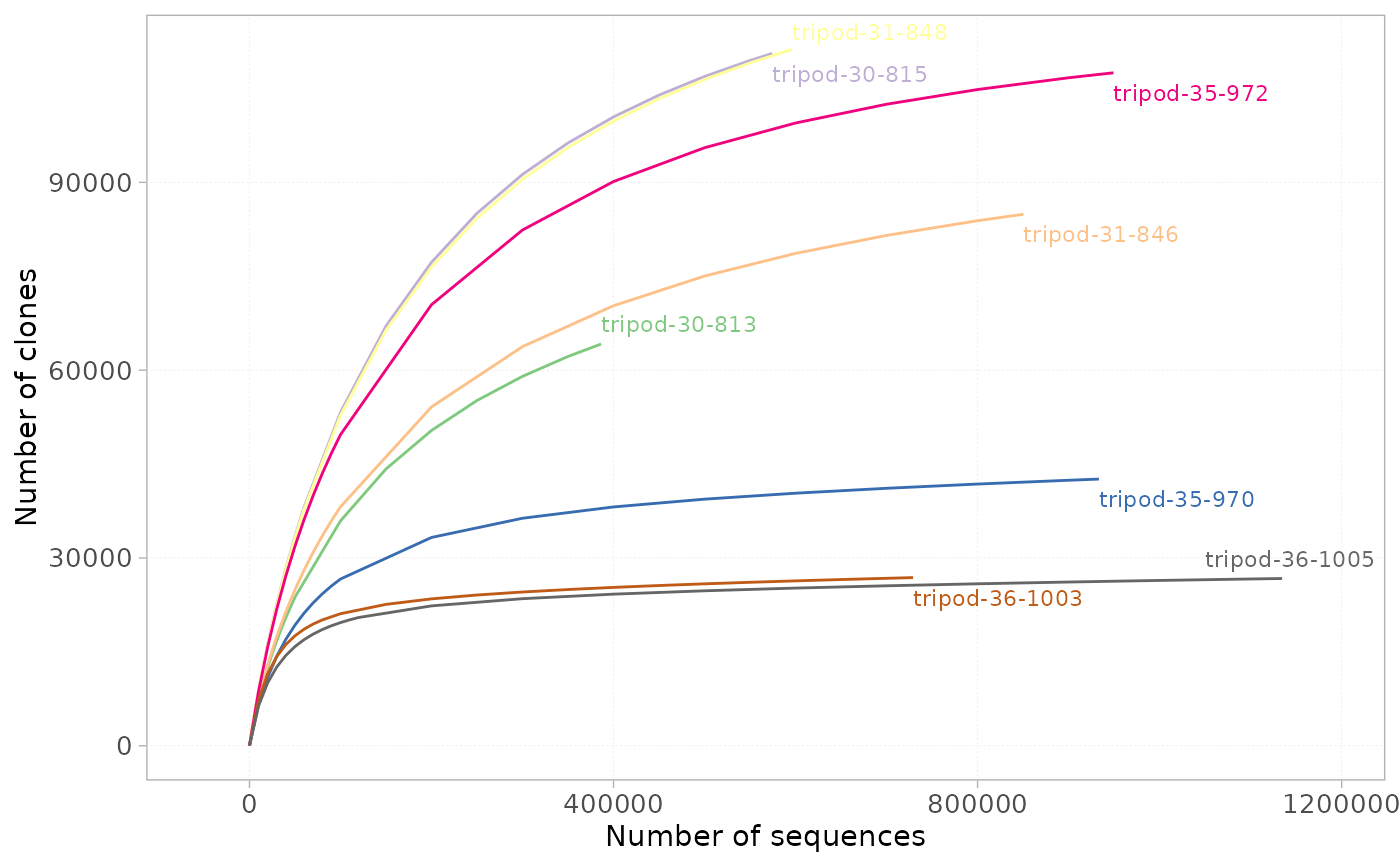
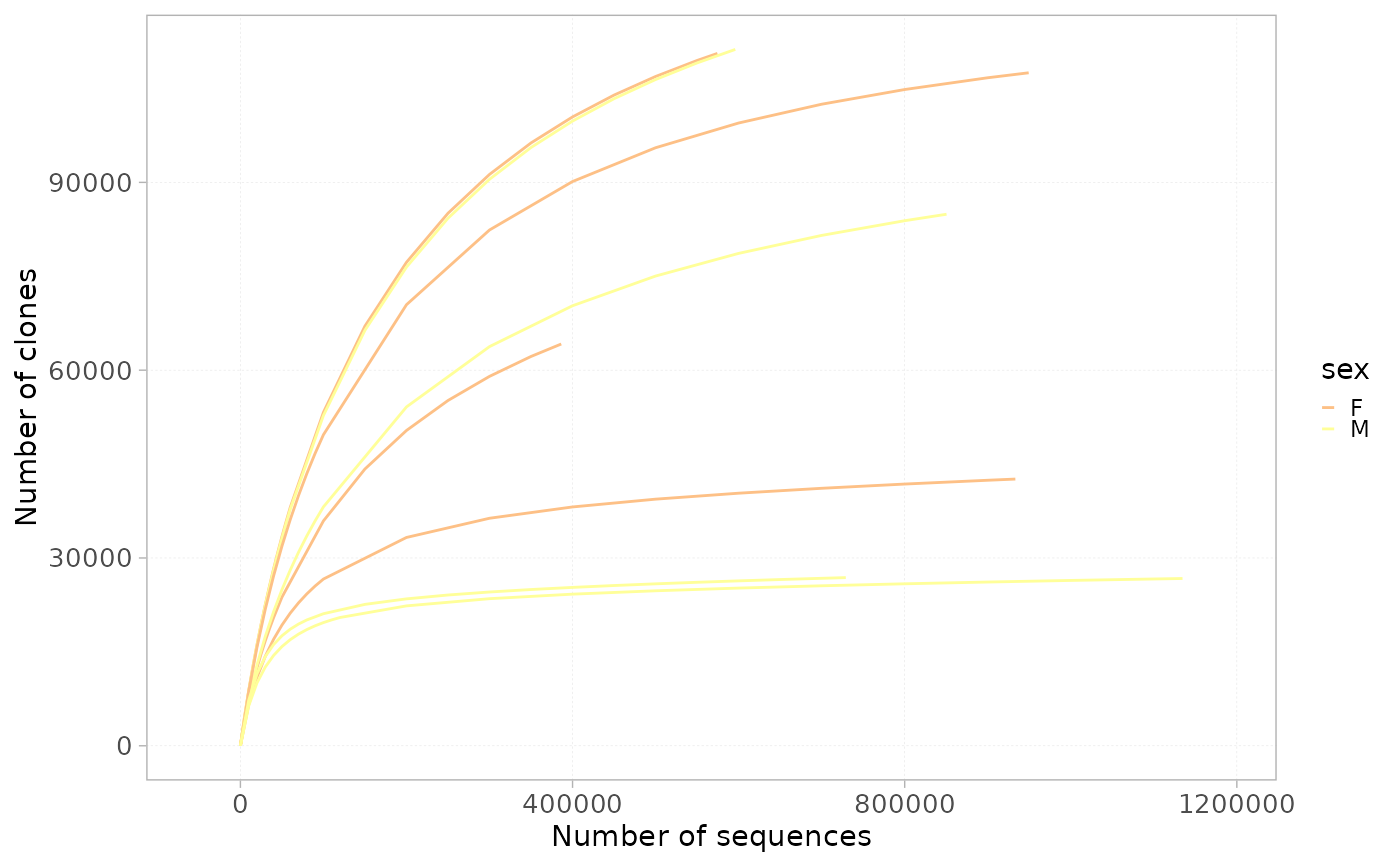
This function plots the rarefaction curve for each sample within the dataset.
Rarefaction is a measure of species richness. The curves plot the number of clones against the number of sequences in a sample, each being obtained by randomly re-sampling a number of sequences multiple times and representing the mean number of found clones.
Arguments
- x
an object of class
RepSeqExperiment- colorBy
a character indicating a column name in mData. Colors are thus attributed to the different groups within this column. The chosen column must be of class factor.
- label_colors
a list of colors for each variable in ColorBy. See
plotColors. If NULL, default colors are used.
Examples
data(RepSeqData)

plotRarefaction(x = RepSeqData, colorBy = "sex")


plotRarefaction(x = RepSeqData, colorBy = "sample_id")