Visualization of basic or diversity statistics for one sample
Source:R/plotFunctions.R
plotIndStatistics.RdThis function plots the statistics in the mData slot and highlights one specific sample amongst all samples.
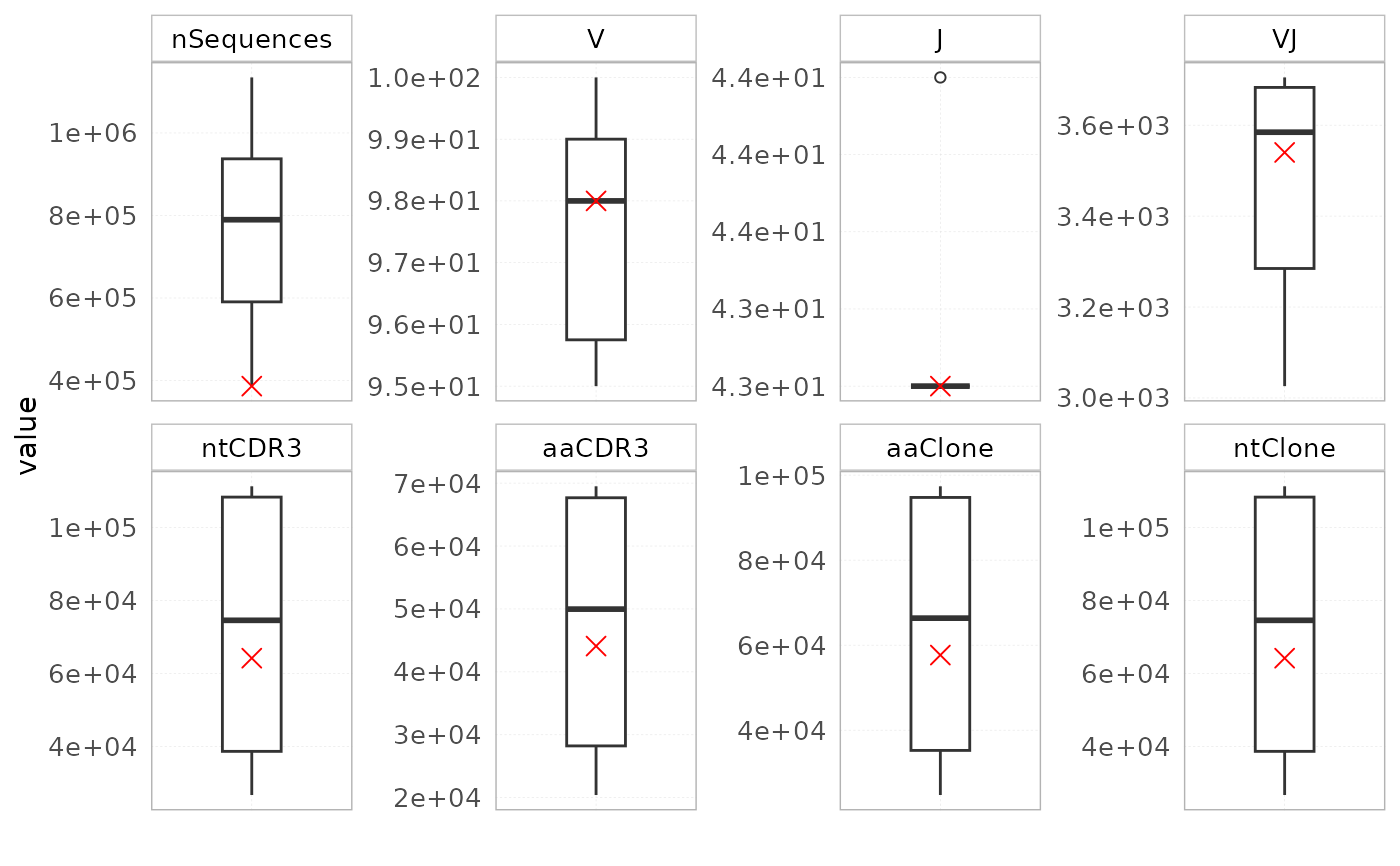
Basic statistics include:
- nSequences: the total number of sequences in a sample
- ntCDR3: the number of unique nucleotide CDR3s
- aaCDR3: the number of unique amino acid CDR3s
- V: the total number of V genes expressed in each sample
- J: the total number of J genes
- VJ: the total number of V-J gene combinations
- aaClone: the number of unique aaClones
- ntClone: the number of unique ntClones
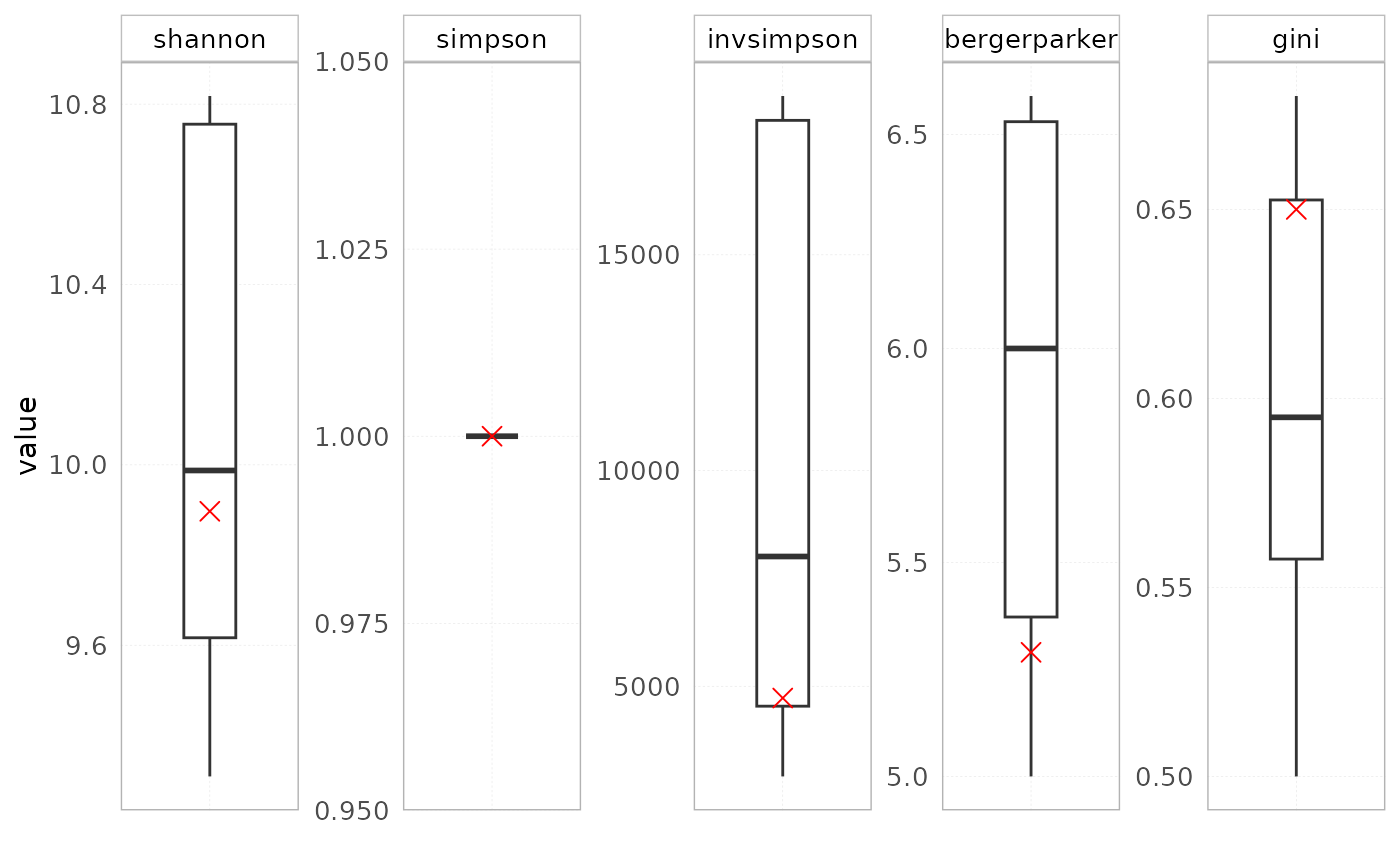
Diversity statistics include:
- Shannon index: Calculates the proportional abundance of species in a repertoire.
- Simpson index: Takes into account the number of species present as well as their abundance. It gives relatively little weight to the rare species and more weight to the frequent ones
- Inverse Simpson index: Is the effective number of species that is obtained when the weighted arithmetic mean is used to quantify average proportional abundance of species.
- Berger-Parker index: Expresses the proportional importance of the most abundant species. This metric is highly biased by sample size and richness (Berger and Parker 1970).
- Gini coefficient: Measures the degree of inequality in a distribution of abundances.
Arguments
- x
an object of class
RepSeqExperiment- sampleName
a character specifying the sample_id to analyze. Default is NULL, which plots the first sample in the dataset.
- stat
a character specifying whether to plot basic or diversity statistics.
- level
a character specifying the level of the repertoire on which the diversity should be estimated. Should be one of "aaClone","ntClone", "V", "J", "VJ", "ntCDR3" or "aaCDR3". Only required when plotting diversity indices.
Examples
data(RepSeqData)

plotIndStatistics(x = RepSeqData, stat = "metadata", level= "ntCDR3" )
#> Plot the first sample in the dataset: tripod-30-813


plotIndStatistics(x = RepSeqData, stat = "diversity",  level = "aaClone")
#> Plot the first sample in the dataset: tripod-30-813
plotIndStatistics(x = RepSeqData, stat = "diversity", level = "aaClone")
#> Plot the first sample in the dataset: tripod-30-813