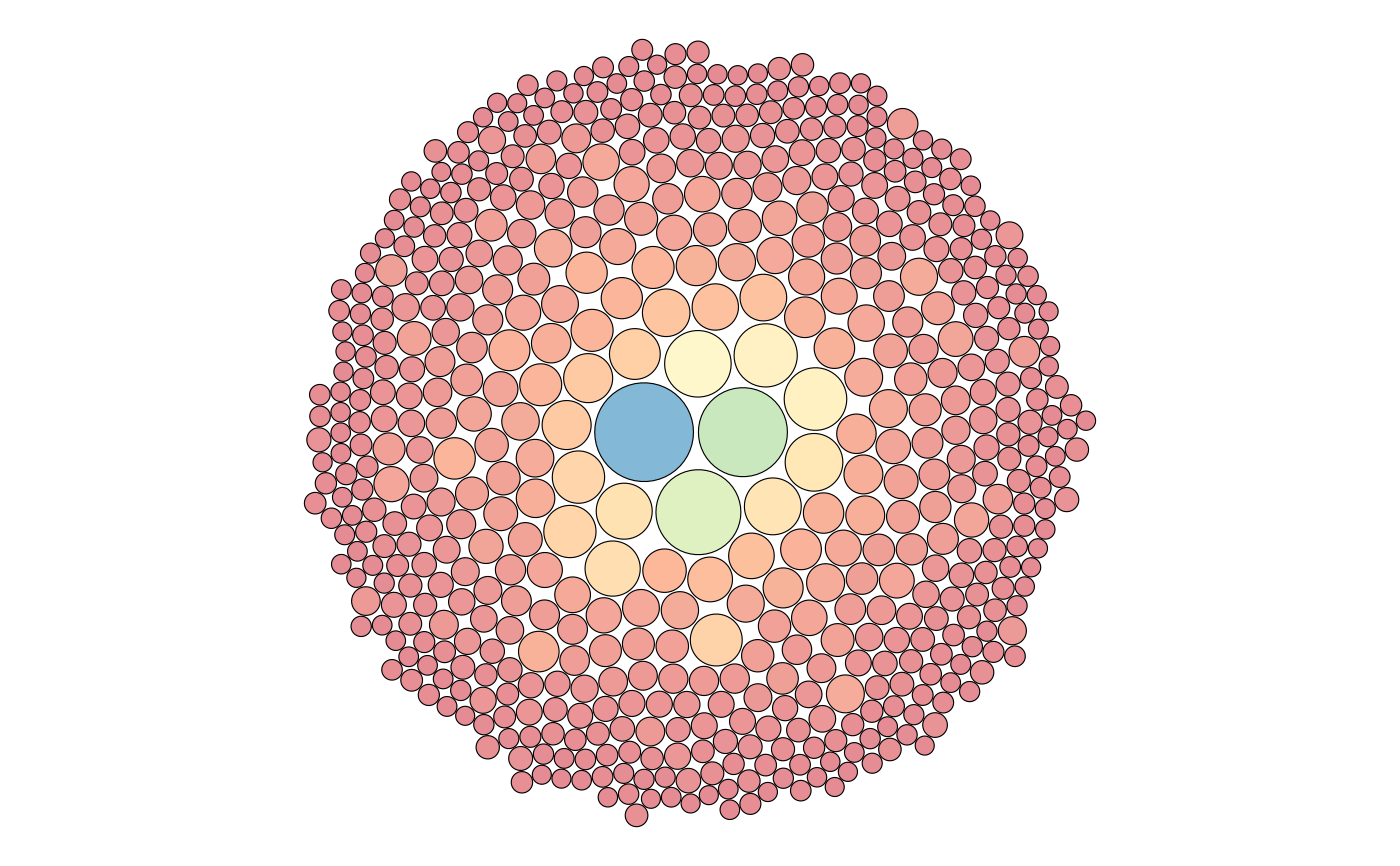
Visualization of a repertoire structure through a circular treemap
Source:R/plotFunctions.R
plotIndMap.RdThis function plots all clones in a single repertoire as a circular treemap, showing the clone distributiion within the repertoire. Each circle represents a unique clone, and the circle size corresponds to the clone count.
Usage
plotIndMap(
  x,
  sampleName = NULL,
  prop = 0.01,
  level = c("aaClone", "ntClone", "V", "J", "VJ", "ntCDR3", "aaCDR3")
)
Arguments
- x
an object of class
RepSeqExperiment- sampleName
a character specifying the sample_id to analyze. Default is NULL, which plots the first sample in the dataset.
- prop
a numeric indicating the proportions of clones to be plotted. It ranges from 0 to 1.
- level
a character specifying the level of the repertoire on which the diversity should be estimated. Should be one of "aaClone","ntClone", "V", "J", "VJ", "ntCDR3" or "aaCDR3".