Visualization of the clonal distribution per interval in a single sample
Source:R/plotFunctions.R
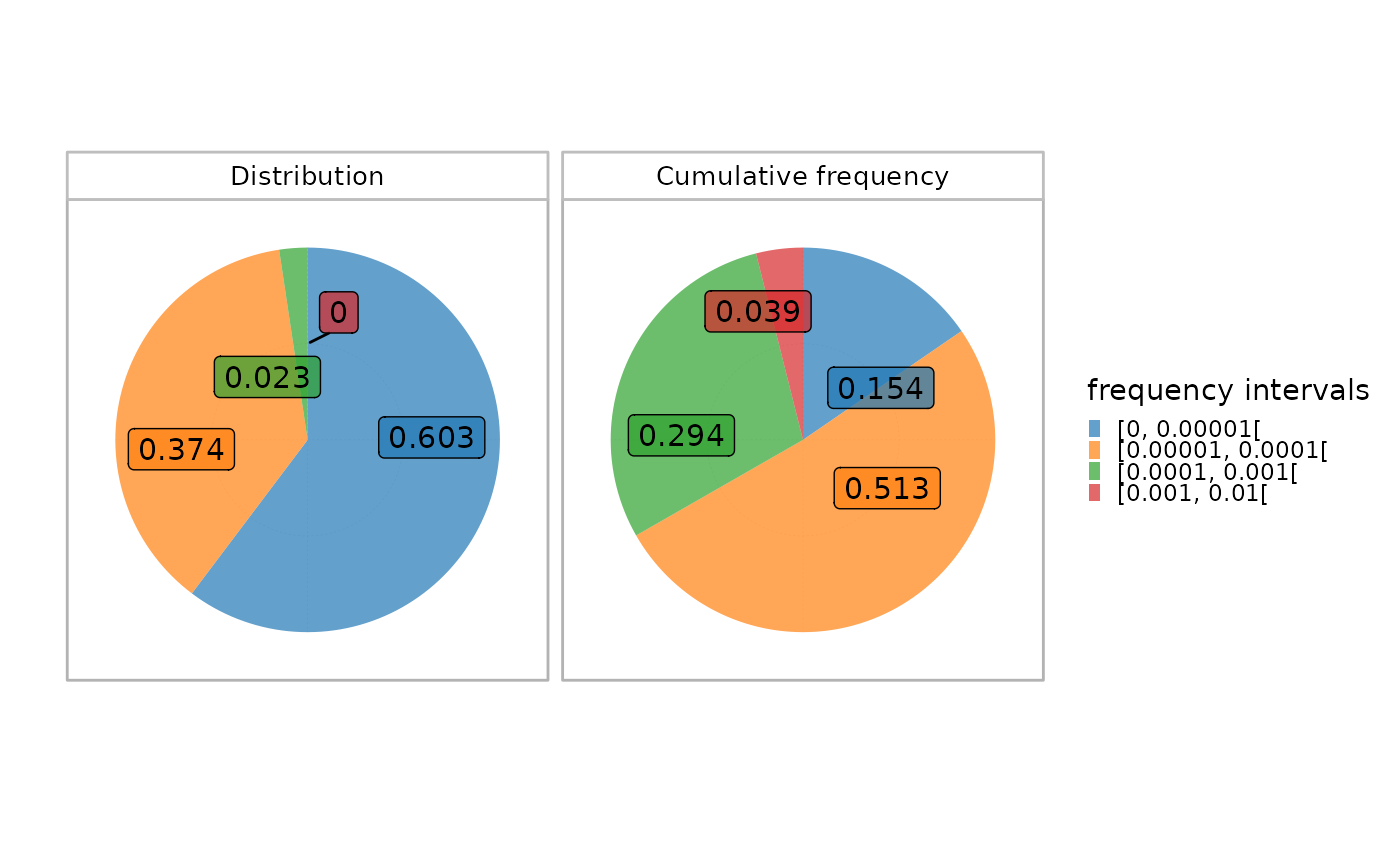
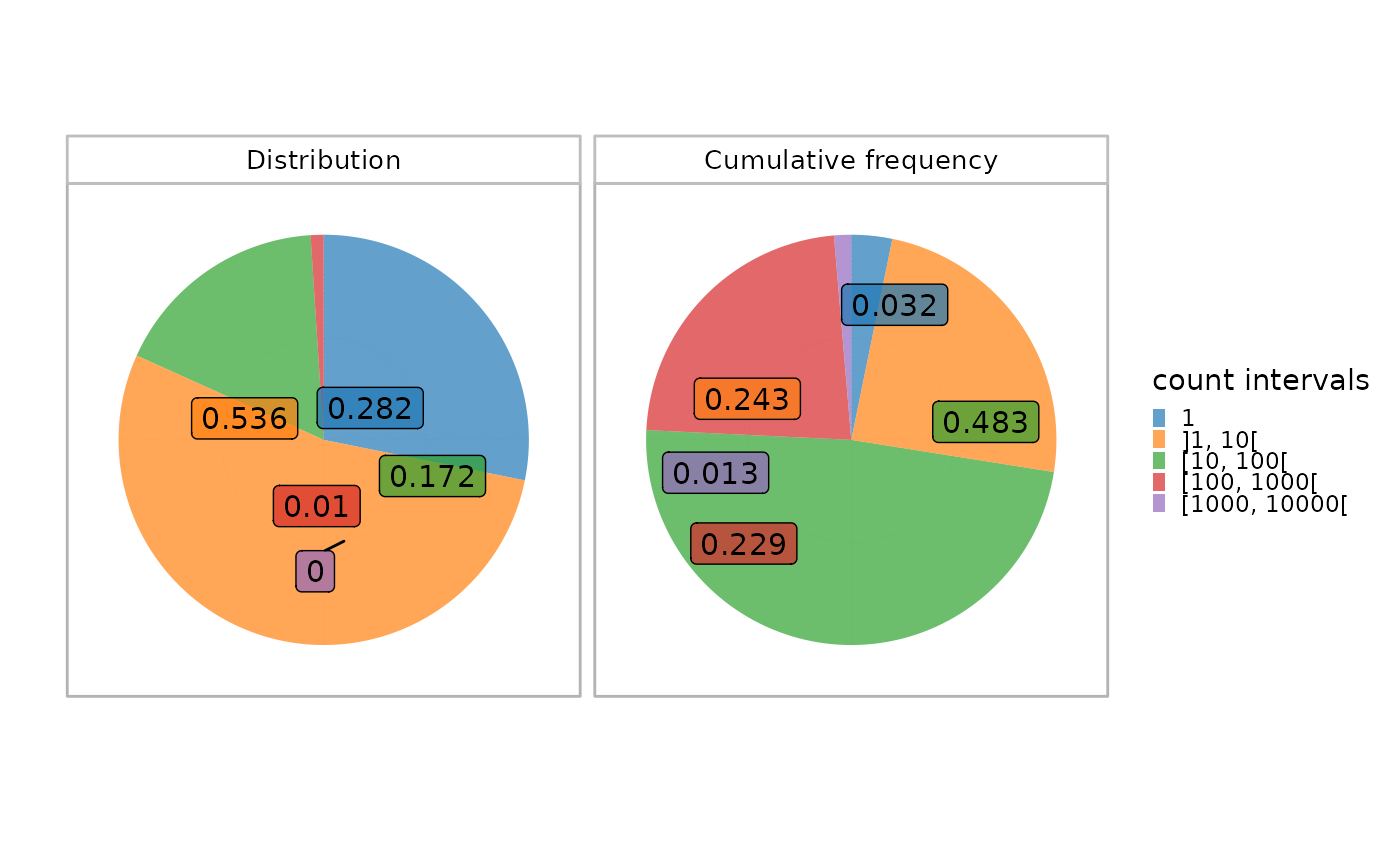
plotIndIntervals.RdThis function plots two histograms of the clonal distribution per a set of fixed intervals in a given sample.
The upper plot calculates the proportion of each interval in the whole repertoire, whereas the lower plot shows the cumulative frequency of the sequences within each interval.
This allows a global view of the repertoire fraction contributing the most to the repertoire. For instance, top sequences belonging to the highest interval often constitute a low fraction of the whole repertoire but contribute more significantly in terms of cumulative frequency in view of their high occurrence.
Arguments
- x
an object of class
RepSeqExperiment- sampleName
a character specifying the sample_id to analyze. Default is NULL, which plots the first sample in the dataset.
- level
a character specifying the level of the repertoire to be taken into account when calculating the clonal distribution. Should be one of "aaClone","ntClone", "ntCDR3" or "aaCDR3".
- interval_scale
whether intervals should be determined in count or frequency
Examples
data(RepSeqData)

snames <- rownames(mData(RepSeqData))

plotIndIntervals(x = RepSeqData, level="aaCDR3", sampleName = snames[1],  interval_scale="count")


plotIndIntervals(x = RepSeqData, level="aaClone", sampleName = NULL,  interval_scale="frequency")
#> Plot the first sample in the dataset: tripod-30-813
plotIndIntervals(x = RepSeqData, level="aaClone", sampleName = NULL, interval_scale="frequency")
#> Plot the first sample in the dataset: tripod-30-813