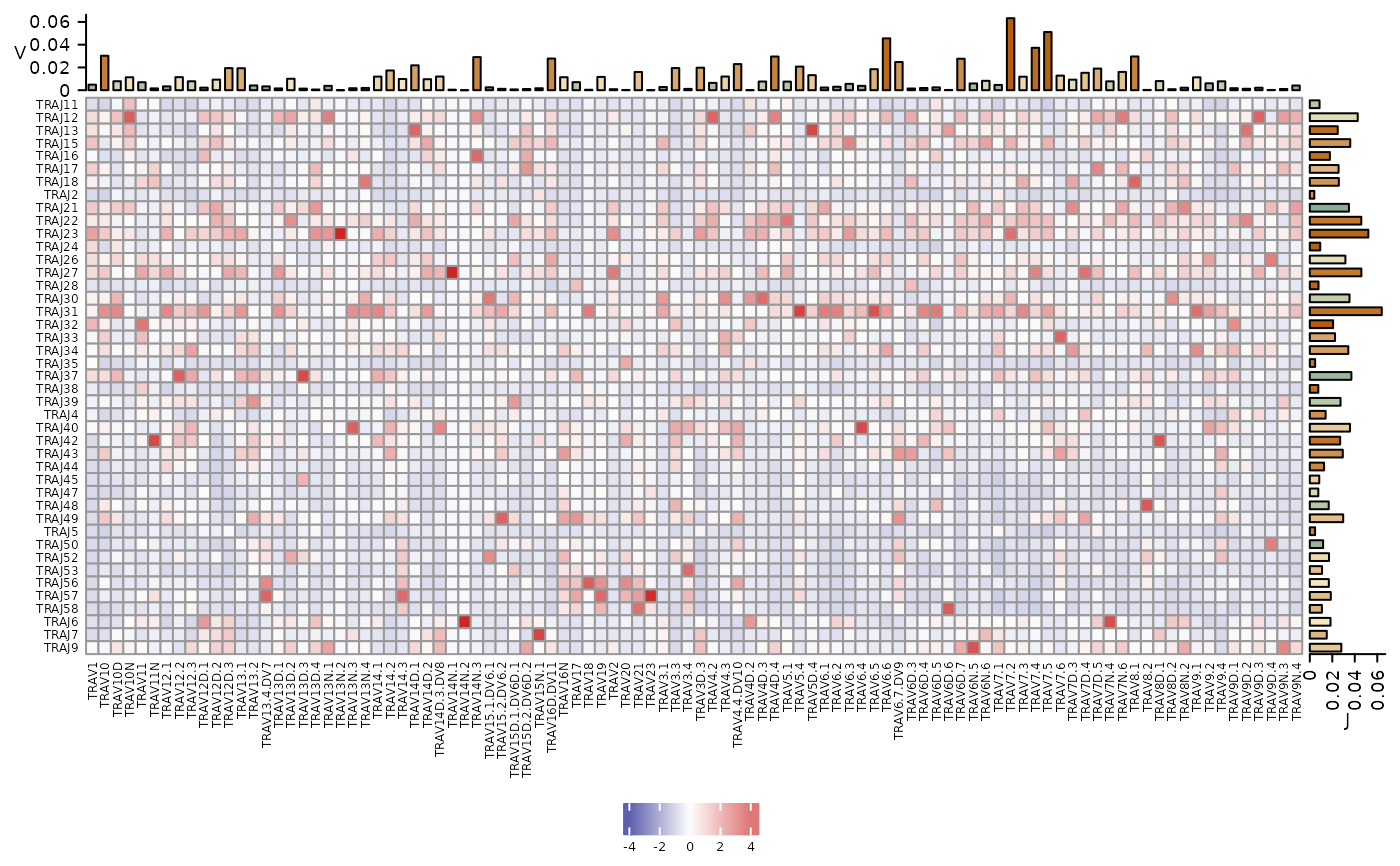
This function plots a heatmap of V and J combination usage within the sample of interest. Frequencies, represented by the color scale, are scaled column-wise. Barplots at the top and right side of the heatmap show the usage of each gene across the row or the column for the V and J genes, respectively.
Usage
plotIndGeneUsage(x, sampleName = NULL, level = c("aaClone", "ntClone"))Arguments
- x
an object of class
RepSeqExperiment- sampleName
a character specifying the sample_id to analyze. Default is NULL, which plots the first sample in the dataset.
- level
a character specifying the level of the repertoire to be taken into account when calculating the gene usages. Should be one of "aaClone" or "ntClone".