This function compares the V or J gene usages between given groups.
Arguments
- x
an object of class
RepSeqExperiment- level
a character specifying the level of the repertoire to be taken into account when calculating the gene usages. Should be one of "aaClone" or "ntClone".
- scale
a character specifying whether to plot the gene usage in "count" or "frequency".
- colorBy
a character indicating a column name in mData. Colors are thus attributed to the different groups within this column. The chosen column must be of class factor.
- facetBy
a vector of character indicating one or two column names in mData to apply a facet on.
- label_colors
a list of colors for each variable in ColorBy. See
plotColors. If NULL, default colors are used.- show_stats
whether to statistically compare groups
Examples
data(RepSeqData)
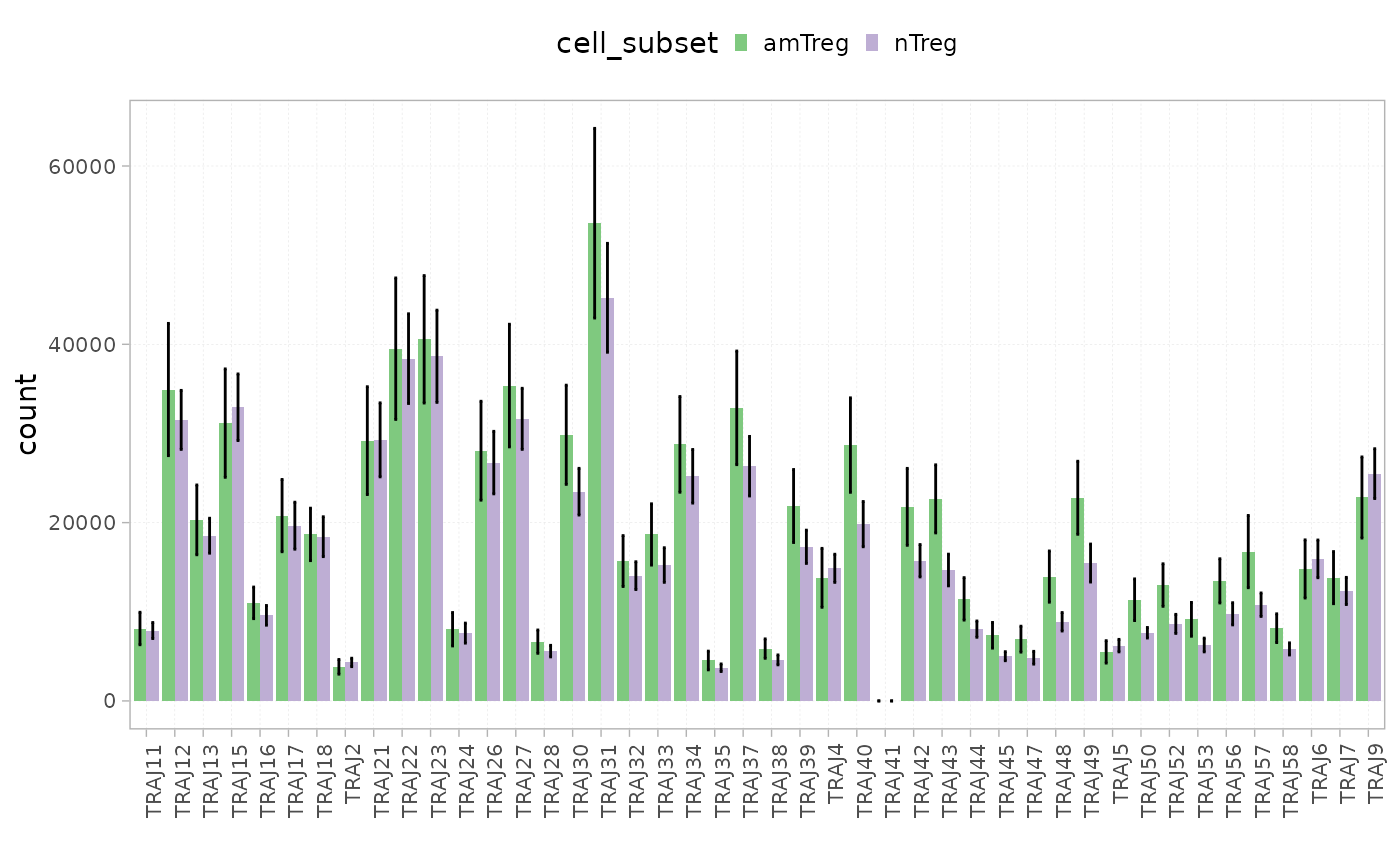
plotGeneUsage(x = RepSeqData,
level = "J",
scale = "count",
colorBy = "cell_subset",
show_stats=TRUE )
#> [1] "Performing Wilcoxon test with Bonferroni correction for 2 groups"
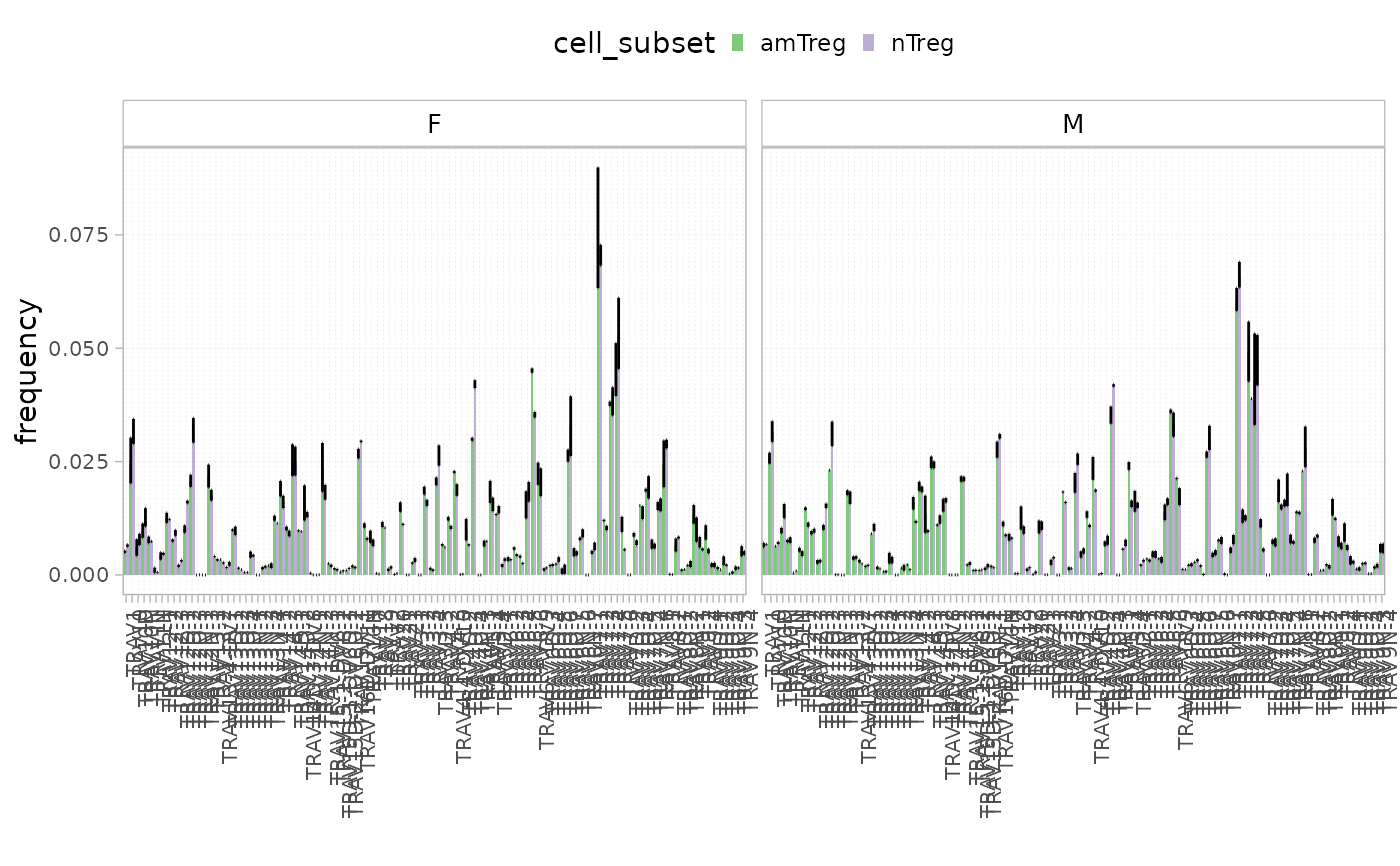
 plotGeneUsage(x = RepSeqData,
level = "V",
scale = "frequency",
colorBy = "cell_subset",
facetBy="sex")
plotGeneUsage(x = RepSeqData,
level = "V",
scale = "frequency",
colorBy = "cell_subset",
facetBy="sex")