This function plots and compares a chosen diversity index calculated on a selected repertoire level between groups of samples.
The calculated indices can be one of the following:
- Shannon index: Calculates the proportional abundance of species in a repertoire.
- Simpson index: Takes into account the number of species present as well as their abundance. It gives relatively little weight to the rare species and more weight to the frequent ones
- Inverse Simpson index: Is the effective number of species that is obtained when the weighted arithmetic mean is used to quantify average proportional abundance of species.
- Berger-Parker index: Expresses the proportional importance of the most abundant species. This metric is highly biased by sample size and richness (Berger and Parker 1970).
- Gini coefficient: Measures the degree of inequality in a distribution of abundances.
Arguments
- x
an object of class
RepSeqExperiment- index
a character specifying the diversity index to be estimated. Should be one of "shannon","invsimpson","simpson", "bergerparker" or "gini".
- level
a character specifying the level of the repertoire on which the diversity should be estimated. Should be one of "aaClone","ntClone", "V", "J", "VJ", "ntCDR3" or "aaCDR3".
- grouped
a character indicating one or multiple groups to be compared. A Wilcoxon test is thus performed and adjusted p-values using the Holm method are shown. Colors are attributed to the different groups within the first column, and a facet is applied on the second column. If not specified, no statistical tests will be performed, and calculated values for each sample_id will be represented.
- colorBy
a character indicating a column name in mData. Colors are thus attributed to the different groups within this column. The chosen column must be of class factor.
- facetBy
a vector of character indicating one or two column names in mData to apply a facet on.
- label_colors
a list of colors for each variable in ColorBy. See
plotColors. If NULL, default colors are used.- show_stats
whether to statistically compare groups
Examples
data(RepSeqData)
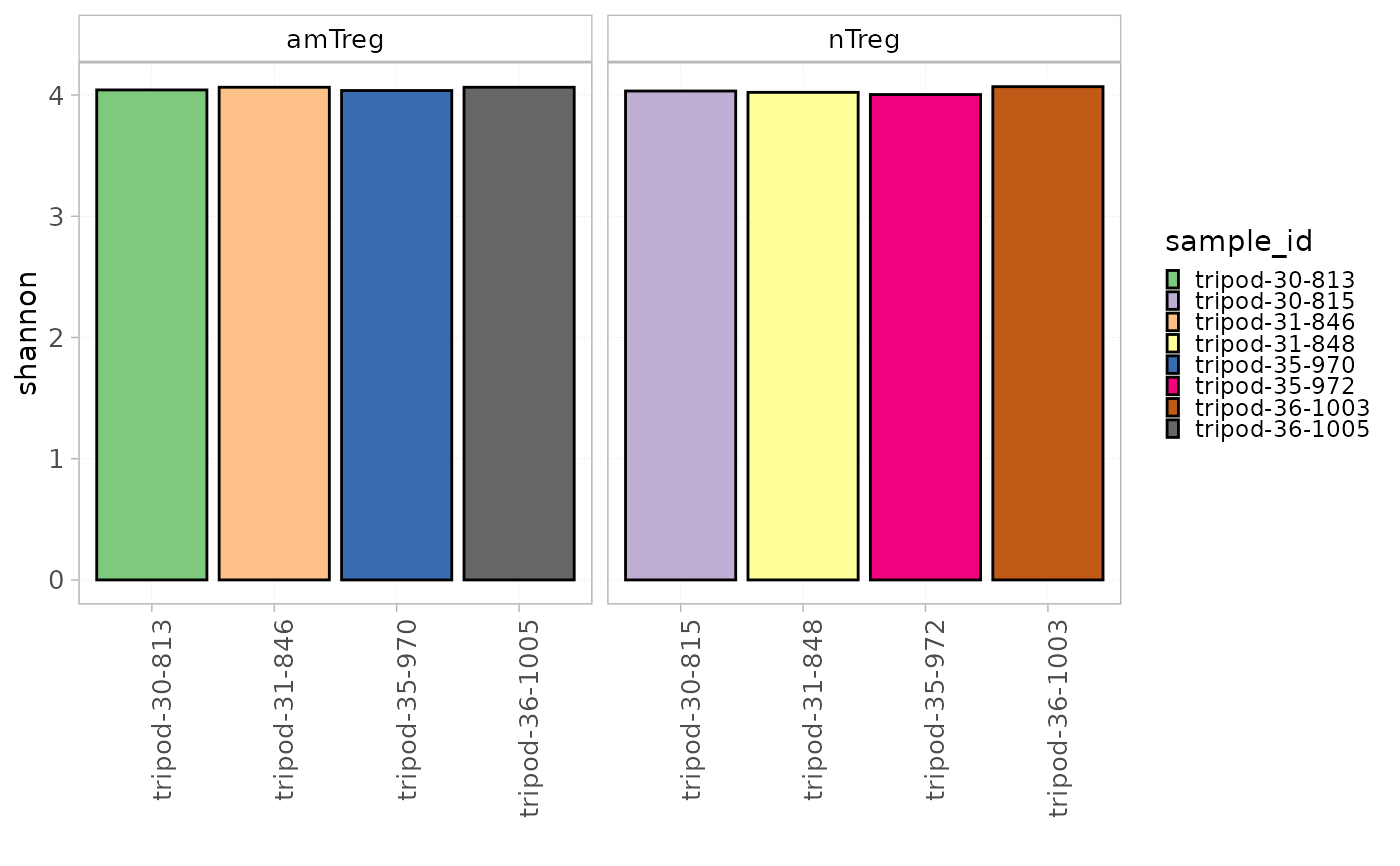
plotDiversity(x = RepSeqData, level = "V", colorBy = "sample_id",
facetBy="cell_subset", index="shannon")
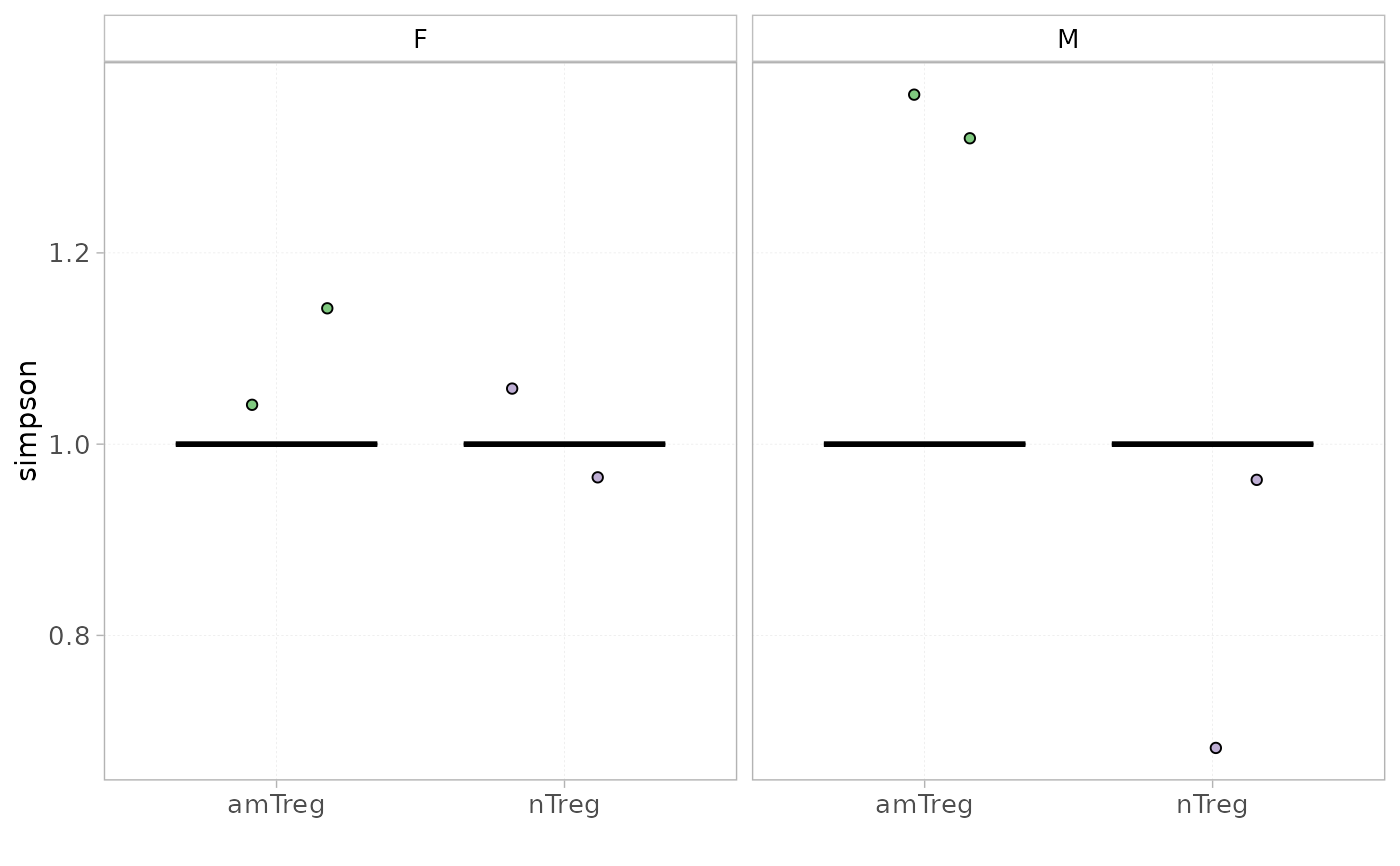
 plotDiversity(x = RepSeqData, level = "ntCDR3", colorBy = "cell_subset", facetBy="sex",
grouped=TRUE, index="simpson")
plotDiversity(x = RepSeqData, level = "ntCDR3", colorBy = "cell_subset", facetBy="sex",
grouped=TRUE, index="simpson")
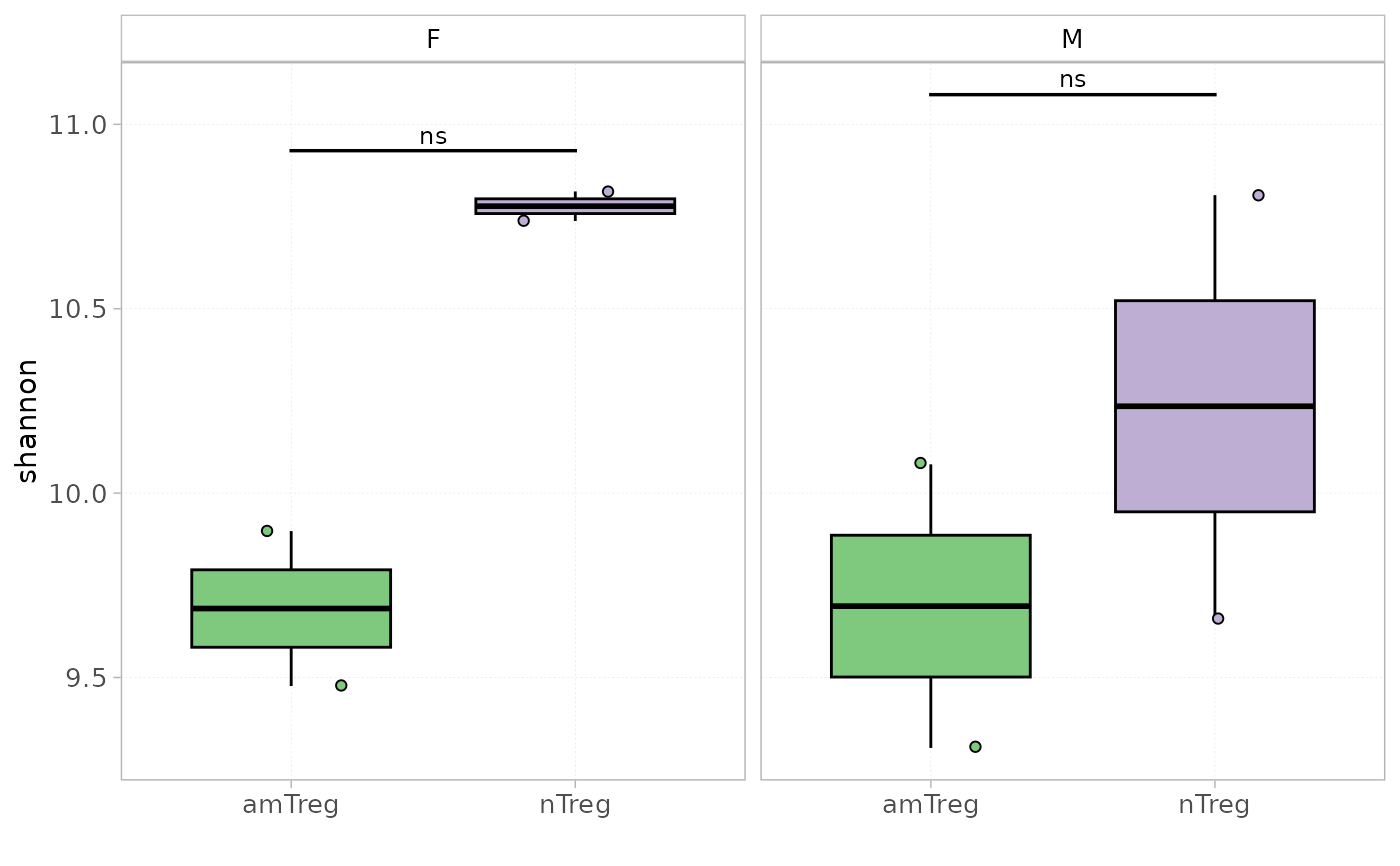
 plotDiversity(x = RepSeqData, level = "aaClone", colorBy = "cell_subset", facetBy="sex",
grouped=TRUE, index="shannon", show_stats=TRUE)
#> [1] "Performing Wilcoxon test with Bonferroni correction for 2 groups"
plotDiversity(x = RepSeqData, level = "aaClone", colorBy = "cell_subset", facetBy="sex",
grouped=TRUE, index="shannon", show_stats=TRUE)
#> [1] "Performing Wilcoxon test with Bonferroni correction for 2 groups"