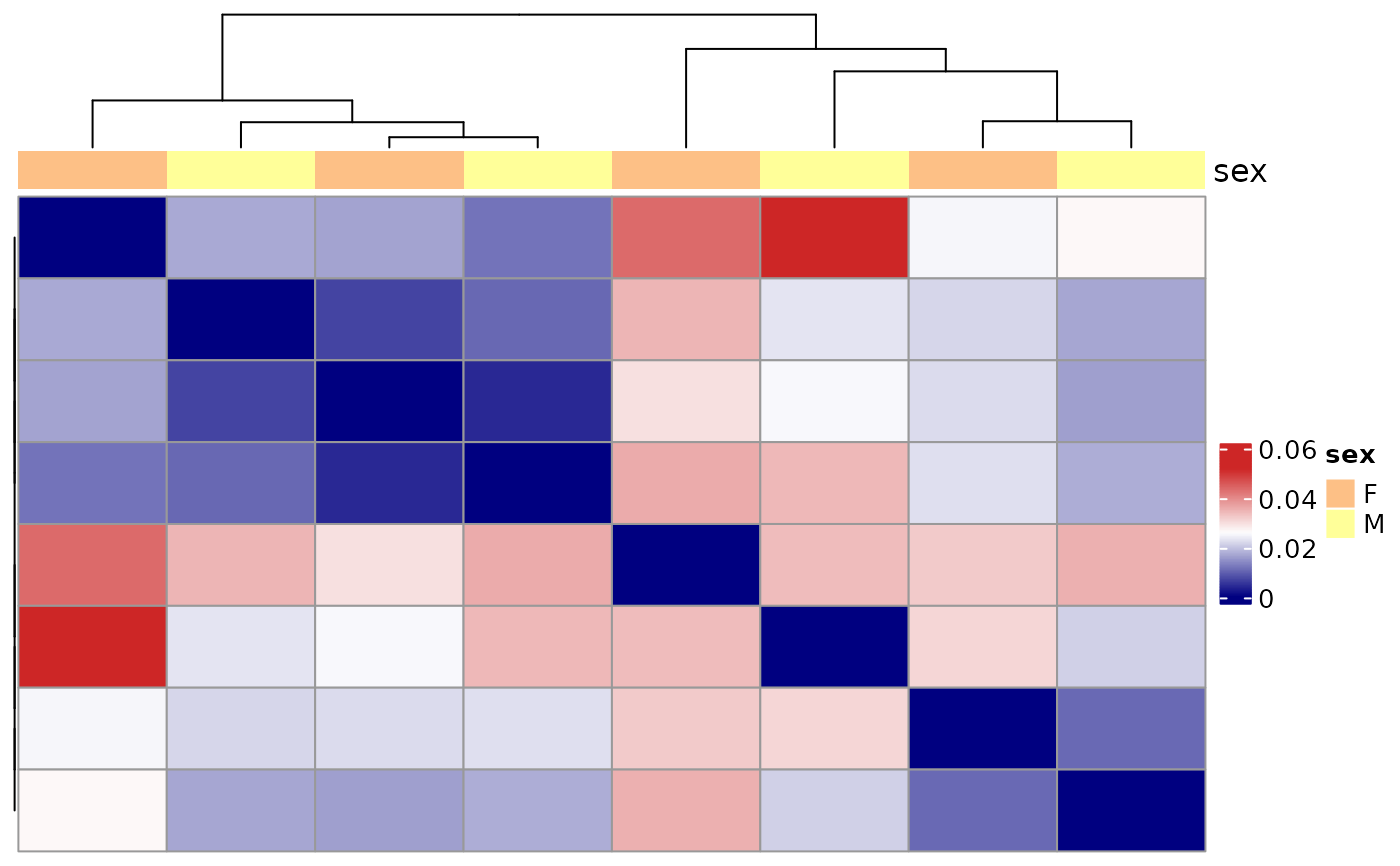
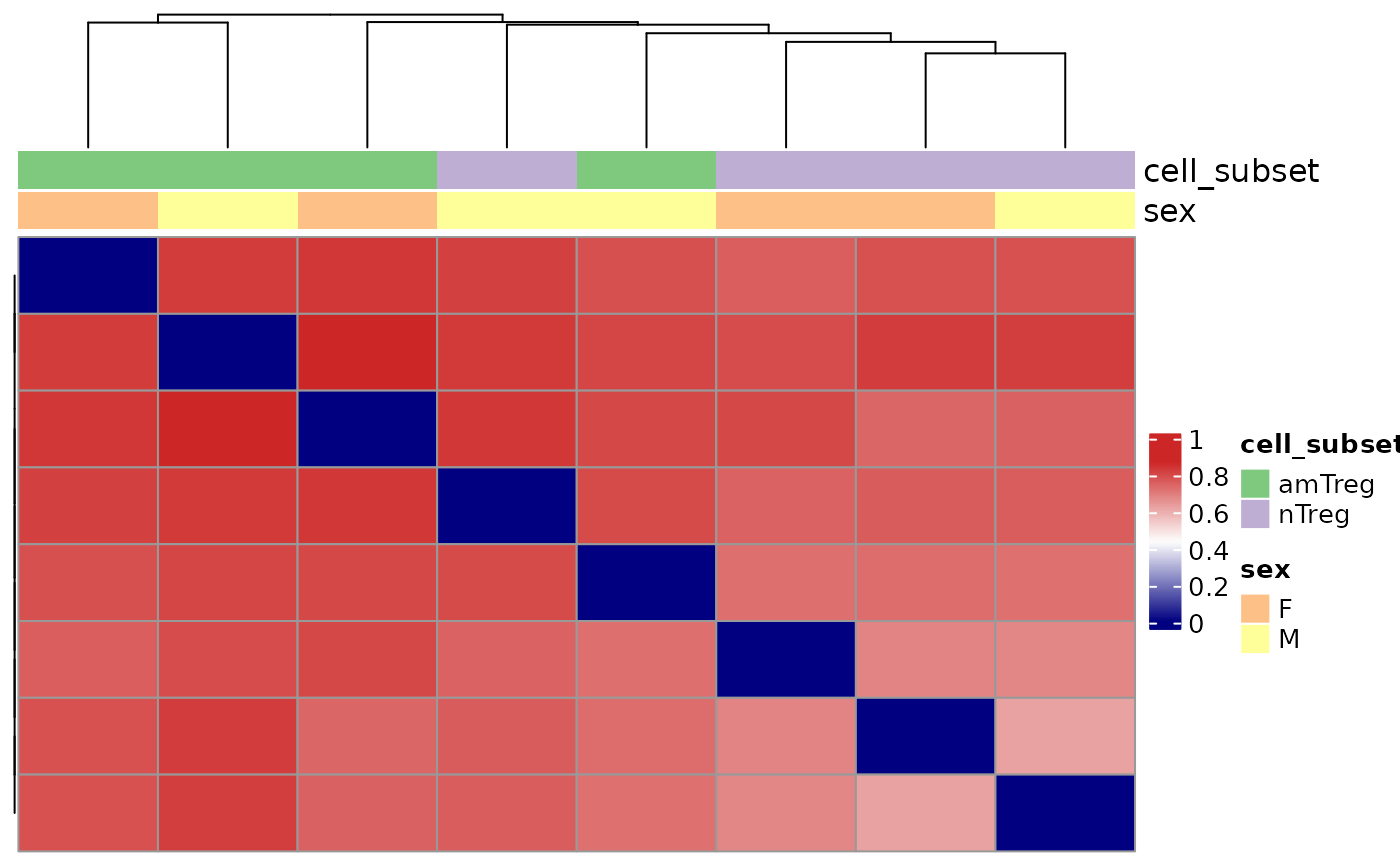
Visualization of repertoire dissimilarities in a heatmap
Source:R/plotFunctions.R
plotDissHeatmap.RdThis function assesses pairwise repertoire dissimilarities using a specific dissimilarity method.
It calculates a list of dissimilarity indices, each taking into account different parameters. The proposed methods include:
The Jaccard similarity: a measure of similarity between sample sets defined as the size of the intersection divided by the size of the union of the sample sets.
The Morisita-Horn similarity: a measure of similarity that tends to be over-sensitive to abundant species.
The function also performs a hierarchical clustering on the calculated distance scores in case the results are represented on a heatmap.
Usage
plotDissHeatmap(
  x,
  level = c("aaClone", "ntClone", "V", "J", "VJ", "ntCDR3", "aaCDR3"),
  method = c("manhattan", "euclidean", "canberra", "clark", "bray", "kulczynski",
    "jaccard", "gower", "altGower", "morisita", "horn", "mountford", "raup", "binomial",
    "chao", "cao", "mahalanobis"),
  clustering = c("ward.D", "ward.D2", "single", "complete", "average", "mcquitty",
    "median", "centroid"),
  binary = FALSE,
  annotation_groups = NULL,
  label_colors = NULL
)
Arguments
- x
an object of class
RepSeqExperiment- level
a character specifying the level of the repertoire on which the indices are computed. Should be one of "aaClone","ntClone", "V", "J", "VJ", "ntCDR3" or "aaCDR3".
- method
a character specifying the distance method to be computed. Should be one of the following: "manhattan", "euclidean", "canberra", "clark", "bray", "kulczynski", "jaccard", "gower", "altGower", "morisita", "horn", "mountford", "raup", "binomial", "chao", "cao", "mahalanobis."
- clustering
a character specifying the clustering method to be used in case a heatmap is plotted. If not, the parameter can be set to NULL.
- binary
a boolean indicating whether or not to transform the data into a presence/absence data. Default is FALSE
- annotation_groups
a vector indicating at least one column name in mData. Colors are thus attributed to the different groups within this column in the MDS. The chosen column must be of class factor.
- label_colors
a list of colors for each factor column in metaData. See
plotColors. If NULL, default colors are used.