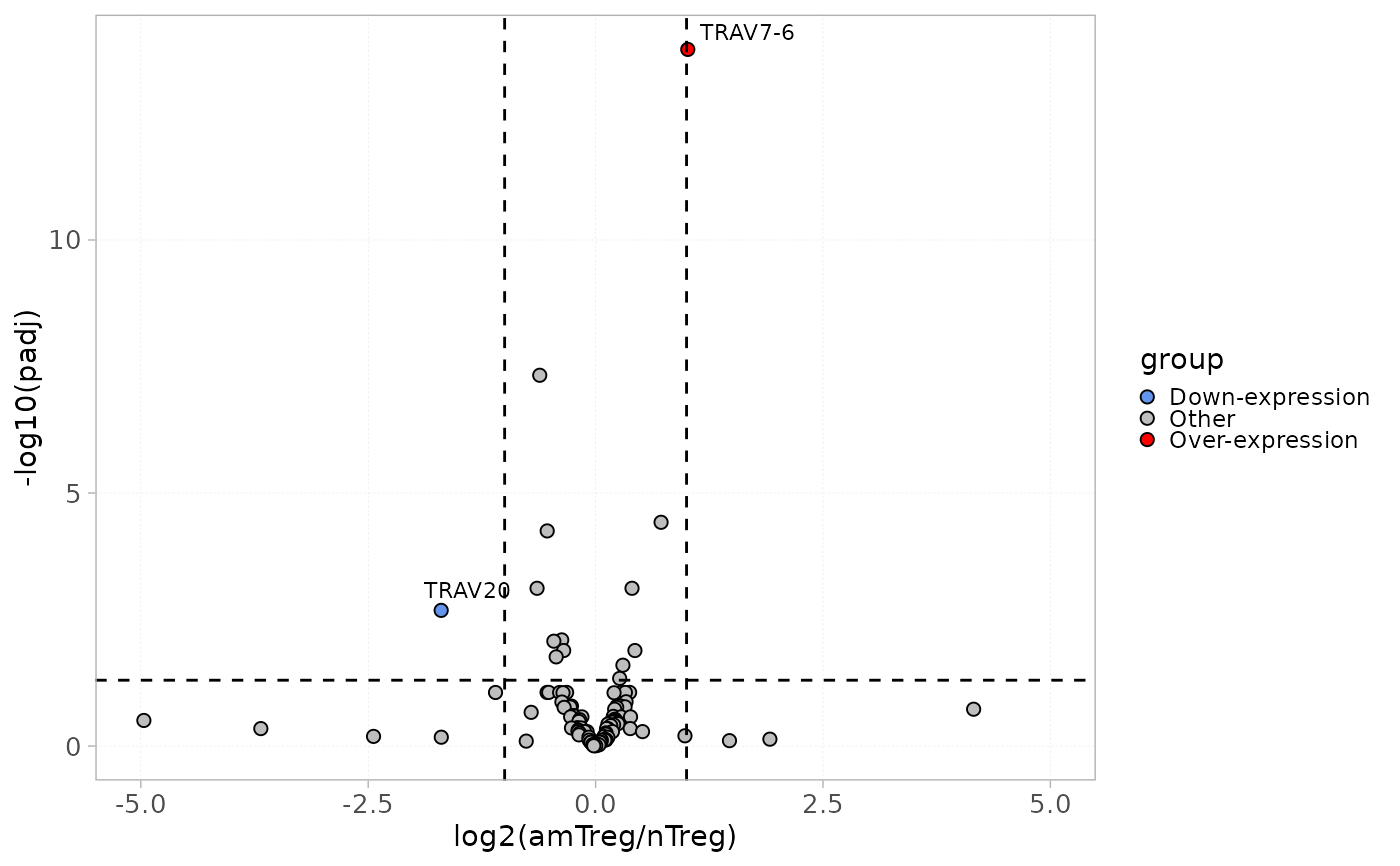
This function plots differentially expressed repertoire levels calculated using the diffExpGroup in a volcano plot.
Arguments
- x
an object of class
RepSeqExperiment- level
a character specifying the level of the repertoire on which the diversity should be estimated. Should be one of "aaClone","ntClone", "V", "J", "VJ", "ntCDR3" or "aaCDR3".
- group
a vector of character indicating the column name in the mData slot, as well as the two groups to be compared.
- FC.TH
an integer indicating the log2FoldChange threshold. Default is 2.
- PV.TH
an integer indicating the adjusted pvalue threshold. Default is 0.05.
- top
an integer indicating the top n significant labels to be shown on the volcano plot. Default is 10.
Examples
plotDiffExp(x = RepSeqData,
            level = "V",
            group = c("cell_subset", "amTreg", "nTreg"),
            top = 10,
            FC.TH = 1,
            PV.TH = 0.05)
#> Warning: some variables in design formula are characters, converting to factors
#> using pre-existing size factors
#> estimating dispersions
#> gene-wise dispersion estimates
#> mean-dispersion relationship
#> final dispersion estimates
#> fitting model and testing
#> Warning: Removed 8 rows containing missing values or values outside the scale range
#> (`geom_text_repel()`).